How Researchers Waste Time Tabulating Data
Sept. 5, 2019, 12:30 p.m.
Although tabulating your research data seems like an easy task, statisticians need your data in a very specific form to analyze it. Following these eight simple rules will keep from wasting your time on data tabulation.
To busy to read the entire article? Skip to the end to see how to download our checklist.
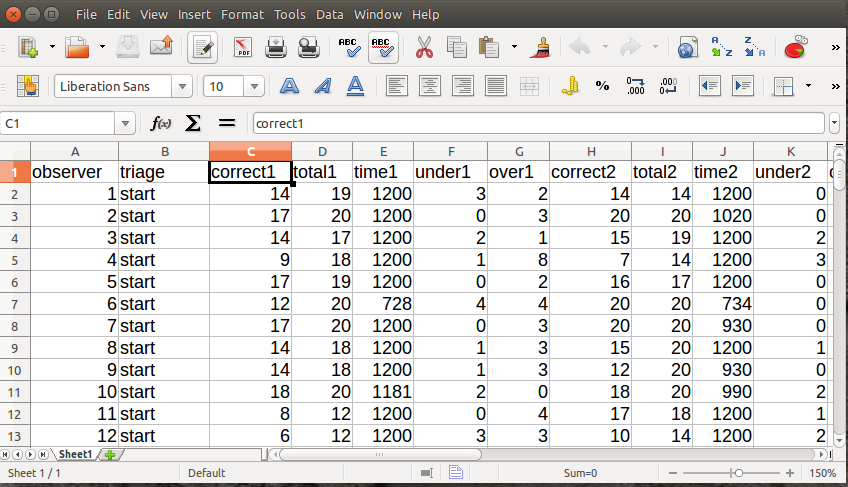
1. Keep it Simple. Most statisticians and most statistics software can read common formats such as Excel spreadsheets, .csv files, or MySQL database tables. Most statistic software does not have robust data entry facilities and it seldom makes sense to learn proprietary data models. We usually recommend that researchers tabulate their data into a single spreadsheet and save it as a .csv file.2. Don't Add Summaries or Calculations. Statisticians will do their own data analysis. Adding calculations such as averages, standard deviations, or p-values does not help. Tabulated data sheet should include only the column names and data. We prefer our clients to give us a clean spreadsheet containing only the data, and encourage the use of a separate document for notes, comments, or clarifications.
3. Use Short Meaningful Column Names. Limit column names to the first row of the table. Ensure that column names are short, meaningful, and contain no spaces or punctuation (except the underscore). Examples of good column names would be "id", "temperature" or "blood_pressure." Examples of bad column names would be "3", "patient blood pressure at presentation" or "$spent." Use unique column names with no duplicate names. We ask our researchers to always use simple column names and provide us with a legend when clarification is necessary.
4. Don't Code Categories as Numbers. Tabulate categorical variables as words or letters. For example, if there are three groups tabulated under the column named "group" then "a", "b", and "c" are preferable to "1", "2", and "3". Even better are meaningful names such as "placebo", "low", and "high." Coding categorical variables avoids the awkward side effect of statistics software calculating meaningless values such as "the average group = 1.7" or "the standard deviation of the group = 0.3". We ensure proper analysis of categorical variables by double-checking our client's datasheets. If you are doing your own analysis this simple rule can be invaluable.
5. Leave Empty Cells Blank. Leave a cell blank when no data is available. Don't pollute the cell with an "N/A", "0", or a secret number such as "999." We encourage our researchers to leave cells blank while we work with them to provide a statistical solution to deal with missing values.
6. Leave Numbers as Numbers. Don't convert numbers to categories at the tabulation phase. For example, if your data table includes age, tabulate the age as a number. Don't divide the age into categories such as "0 - 16", "17-35", etc. Also, don't include "about 17" or "under 1" in such a column. Statistical power is best with the use of numbers over categories.
7. Split Multi Responses to Several Columns. Survey data is one common source of questions that can contain many responses. Consider the survey question: "Check any of the following educational events you have attended." The responses "conference", "online", and "text" may all appear in a single response. Divide this question into three columns labeled "conference", "online", and "text." Mark "yes" or "no" in the column for each participant. This can sometimes be a bit tricky - so we like to work with our clients in advance.
8. Sheet Before Data. If you work with a statistician, have them check your spreadsheet before adding the data. We like to work in partnership with our clients at the outset. We either design the spreadsheet for them or review their spreadsheets before any data tabulation.
We cringe every time we need to send a spreadsheet back to the researcher to have them revise it for data analysis. This is all the more painful when the researcher has spent his or her valuable time with beautiful but unnecessary formatting. Follow these simple eight steps to avoid wasting your time.Are you ready to stop wasting your time on data tabulation? Click here to download our data tabulation checklist.
Are You Ready to Increase Your Research Quality and Impact Factor?
Sign up for our mailing list and you will get monthly email updates and special offers.